It’s our competitive nature that drives us to want to know how everyone else is doing in terms of their open rate, click rate, and other email marketing metrics. However, once we have this aggregated, averaged benchmark data, we don’t always know how to act on it. For some, they provide false comfort; for others, false alarms.
Often calculated out to hundredths of a percentage point, benchmark averages appear to be a very specific bar to clear in order to be “above average”—and some marketers use them this way, occasionally with bonuses on the line. However, the deep specificity of these data points really just reflect the incredibly rich data behind the calculation.
In actuality, these numbers are very fuzzy because of the apples-to-oranges comparisons taking place behind the scenes. Knowing that hundreds or thousands of companies collectively average an open rate of 20.45%, for instance, is actually less valuable to an individual company that it appears. I’m not saying benchmarks are completely unuseful, just that they’re usually only helpful in a very general way for the following reasons:
1. Audience response is different depending on the subscribers’ country or region. Cultural norms and expectations can vary greatly from region to region—and often those norms get translated into laws and regulations. For instance, Europe is much stricter about permission than the United States is. These variances create differences in list growth rates, engagement rates, etc. So beware of comparing your metrics to those from companies in another country.
2. Audience response is different depending on the industry vertical. Subscribers have different expectations around frequency and messaging for emails from, for instance, a school or university versus a retailer. Aggregate figures can skew things one way or the other, so look for a breakdown of stats by vertical.
IBM Silverpop’s 2015 Email Marketing Metrics Benchmark Study does a great job of tackling these first two limitations of benchmarks—as well as breaking the data down into more useful quartiles and acknowledging the limitation of benchmarks. They break down metrics into 5 global regions and 17 industry verticals. However, even doing that, there are more limitations.
3. Audience response is different depending on the industry sub-vertical. Retail, which I’ve been covering for nearly 15 years, is the perfect example. The buying cycles and shopping frequencies for big box retailers like Walmart and Target are wildly different than those for big ticket durables retailers like Dell and Tiffany & Co. Beyond that, there can be very different email expectations depending on a retailer’s business model. For example, deal-a-day retailers like Zulily can get away with daily mailings while most other retailers cannot.
Benchmarks are rarely, if ever, reported at this level of granularity, because we’re really at the level of competitive sets at that point, which is the territory of consultants and competitive intelligence providers. But even at that level, businesses are unique, making them only roughly comparable to each other, which we address further in looking at the next two limitations.
 | 2018 State of Email AnalyticsHow do your email analytics capabilities stack up against your peers? See what email metrics brands measure (and what tools they use to do so) with our first-ever State of Email Analytics report. |
4. Audience response is different depending on the brand’s business strategy and email marketing goals. Your strategy may not be the same as other companies for a variety of reasons, and therefore the behavior you are trying to drive with your email program may be different. For instance, sticking with the retail industry, IKEA and some other retailers don’t sell online, so their email marketing strategies are all about getting subscribers to visit their stores. That affects how they message their subscribers, the calls-to-action they use, and most assuredly their email marketing success metrics.
Media is another industry where goals may vary. For instance, some outlets may be all about driving traffic to their websites so they only include content teases in their email to spur clickthroughs, whereas others may include a lot of content—and ads—directly in their emails, so maximizing opens (and therefore ad impressions) is the goal.
5. Audience response is different depending on how a brand manages their email list. This is probably the biggest unknowable and could be the biggest reason why your numbers may be wildly different from other companies. How a brand manages their email list can massively change their metrics, particularly those where emails sent is the denominator, such as open rate and click rate.
At one end of the spectrum is segmentation and triggered emails, which generate high response rates because they deliver messages to the people who are most likely to respond to them. If your brand sends a lot of these, your open and click rates will be substantially higher than brands that send less.
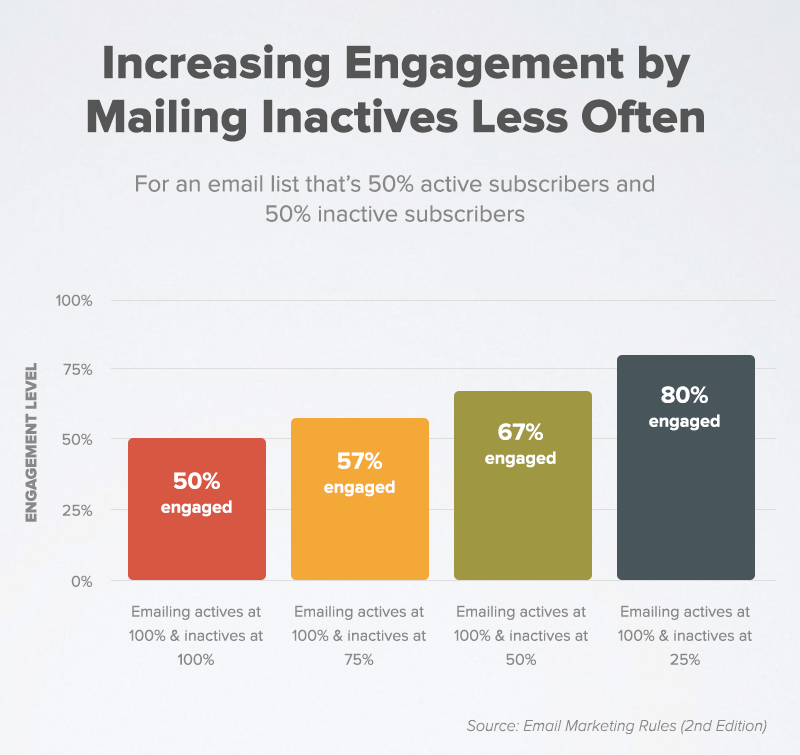
At the other end of the spectrum is inactivity management. If you have a lot of inactive subscribers on your list and mail them frequently, that suppresses your open and click rates since very few of these subscribers are likely to engage. On the other hand, if you keep a tight rein on inactives by dramatically reducing the frequency at which you email them and re-permissioning them if they continue to not respond, your open and click rates are likely to be much higher.
Dramatic changes to how often you email your inactives can double your open and click rates overnight. The following chart demonstrates how changing the frequency at which you email inactives can benefit how engaged your subscribers appear in the eyes of ISPs, which take their user engagement into account when deciding whether to filter your emails.
How to Use External Benchmarks
Given all of these limitations, here are a few ways that benchmarks can be helpful:
First, focus on the trends over times. Oftentimes the change in a benchmark over time is way more useful than the absolute value at a specific point in time. Have open rates risen or fallen over the past 6 months? How did yours change over the same timeframe? If rates generally improved while yours fell, then that may be worth investigating.
Second, pay attention to variations across regions. If you operate in more than one country or region, and you can find benchmark data that matches those areas, then look at how metrics differ from one to the other. Do you see a similar spread in your own data?
Third, focus on metrics that are pegged to opens rather than sends, such as click-to-open rates and forward-to-open rates, which is the metric that we focused on in The Viral Email report. These metrics are more stable because they are affected much less by how often marketers emails their inactive subscribers.
And fourth, being in the bottom quartile should raise concerns. Companies often treat benchmarks as concrete goals to match or beat. To do so ascribes way too much precision and relevance to benchmarks in relation to your company’s business model, audience, and goals. However, being in the bottom quartile of a benchmark should sound some alarms and demand a little digging to determine why your performance is so comparatively low.
Why Internal Benchmarks Are Better
Rule 17 from my book, Email Marketing Rules, is: “Benchmark yourself primarily against yourself.” Even if you have the best benchmarks in existence, the data that is most relevant to your company’s future success is your own data. Especially in the Age of Big Data, marketers have tons of information about their subscriber and customer behavior at their disposal.
Identify the metrics that move the needle for your company and then reflect that in your email marketing strategy and goals. From there, focus on systematically beating your own performance by embracing a philosophy of incremental improvements to the subscriber experience through testing, segmentation, personalization, triggered messaging, and other enhancements.
If you’re constantly generating small year-over-year improvements to your email metrics, chances are you’ll have very little need to be concerned about external benchmarks.
The info in this blog is 2+ years old and may not be updated. See something off? Let us know at hello@litmus.com.

Chad S. White is the Head of Research at Oracle Digital Experience Agency.
